Monitor and control sync jobs in your Console's fasp transport network
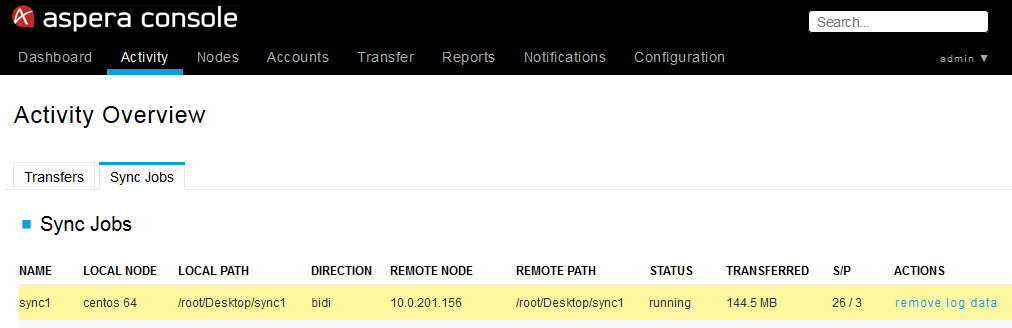
If your managed nodes are running Enterprise (or Connect) Server v3.1.5+, and you configured Console to poll the Node API (see the topic "Adding Managed Nodes," then you can monitor Aspera Sync jobs. Once you have initiated a sync transfer, you can view it from the tab. Click a sync transfer to view the session details (the row will highlight when you hover over it).
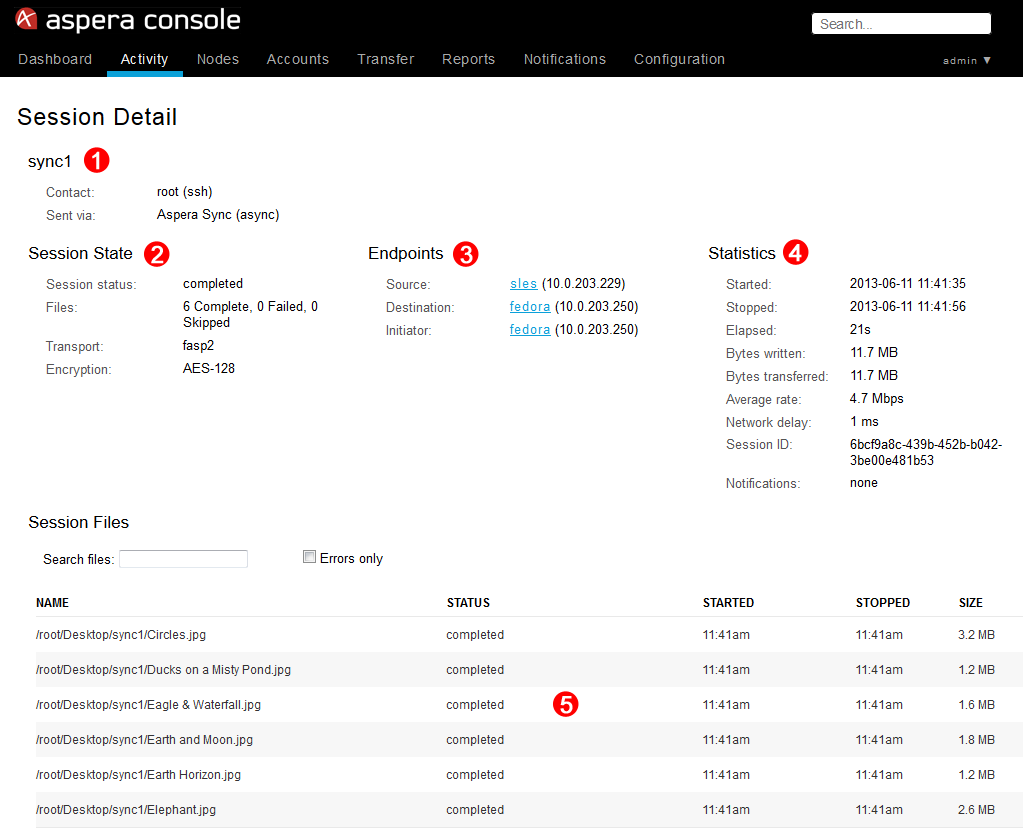
On the sync transfer's Session Detail page, you'll see the following information:
- (1) Session name.
- (2) Session State, which includes the session's status and synced files.
- (3) Sync source and destination.
- (4) Transfer statistics.
- (5) Details for synced files (which you can hover over and select within the Session Files table).
This reporting information may not appear immediately.
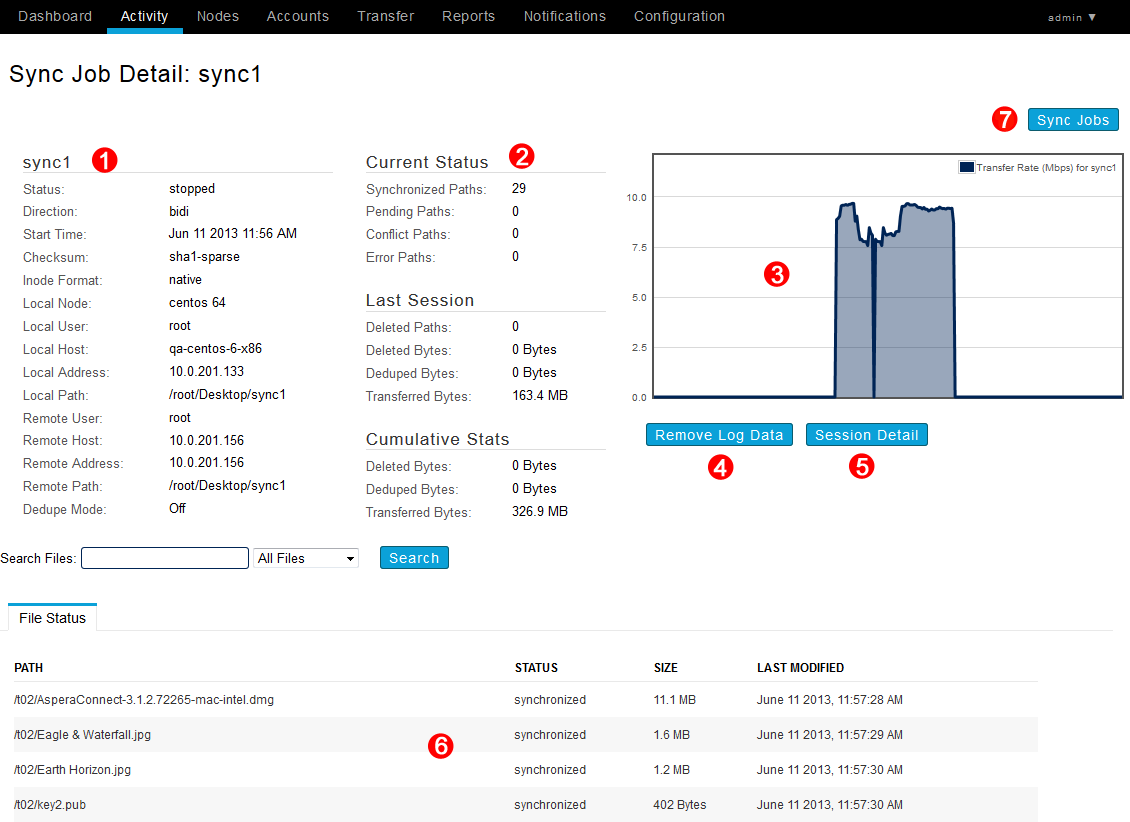
From the Sync Job Detail page, you can view the following information:
- (1) Local and remote server details, as well as session statistics (how many paths are synced/pending/conflicted/deleted/in error state).
- (2) Session statistics.
- (3) Transfer rate graph (Mbps vs time), which only appears during the transfer.
- (4) Remove log data button, which deletes this job's stats from the Console and async databases.
- (5) Session Detail button, which takes you to the Session Detail page described above.
- (6) Synced file information (status, size, and date/time modified).
- (7) Returns you to the Sync Jobs page.
When using the search-file boxes in the Activity Overview, Session Detail, and Sync Job Detail pages, the asterisk (*) is not a wildcard. Any string you enter as a filter is treated as a "search within". In other words, the string "foo" matches "123foo", "foo456", and "123foo456".