The Console Dashboard
The Dashboard provides a quick overview of all transfer activities and the statuses of nodes for which you have monitoring permissions. It gives continuous updates and helps identify transfer and node problems.
Go to Dashboard. The Dashboard contains the following six panels:
Current Transfers
Current Transfers lists up to ten ongoing transfers on all monitored nodes. To view all active transfers, click the Current Transfers header.
Scheduled Transfers
Scheduled Transfers lists up to ten scheduled transfers on all monitored nodes. To view all scheduled transfers, click the Scheduled Transfers header.
Recent Transfers
Recent Transfers lists up to ten recent transfers on all managed nodes. To view all recent transfers, click the Recent Transfers header.
Problem Transfers
Problem Transfers lists up to ten transfers with errors on all managed nodes. To view all transfers with errors, click the Problem Transfers header.
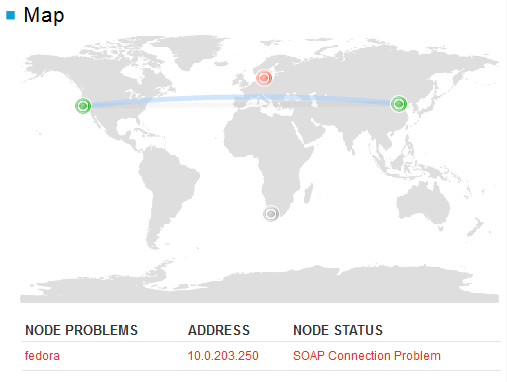
Map
The map shows the status of all your monitored nodes and shows the transfers between them. If a node fails, the icon becomes red in the map, and the node and the problem are listed in the table below the map.
Nodes are not automatically added to maps. They must be configured. For more information, see Configuring the Map.
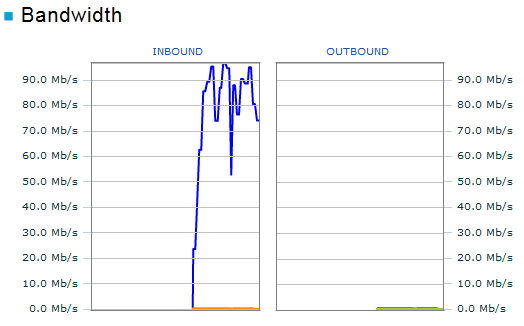
Bandwidth
The Bandwidth chart shows bandwidth usage of your monitored nodes. If you select one or more nodes on the map, the chart shows the cumulative bandwidth of the selected nodes.