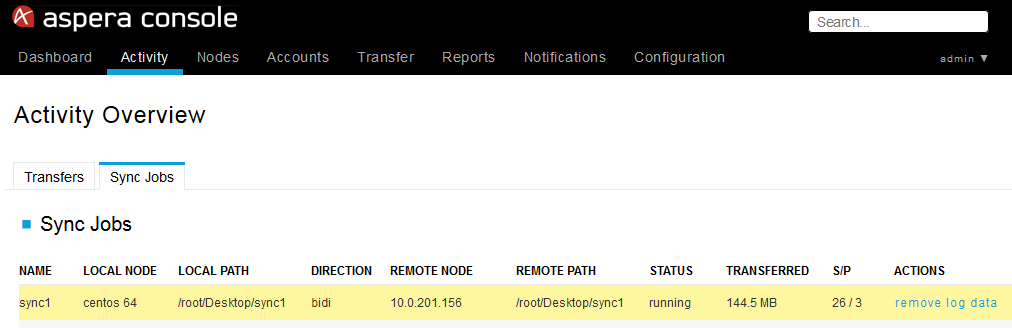
If your managed nodes are running Enterprise (or Connect) Server v3.1.5+, and you configured Console to poll the Node API (see the topic "Adding Managed Nodes," then you can monitor Aspera Sync jobs. Once you have initiated a sync transfer, you can view it from the tab. Click a sync transfer to view the session details (the row will highlight when you hover over it).
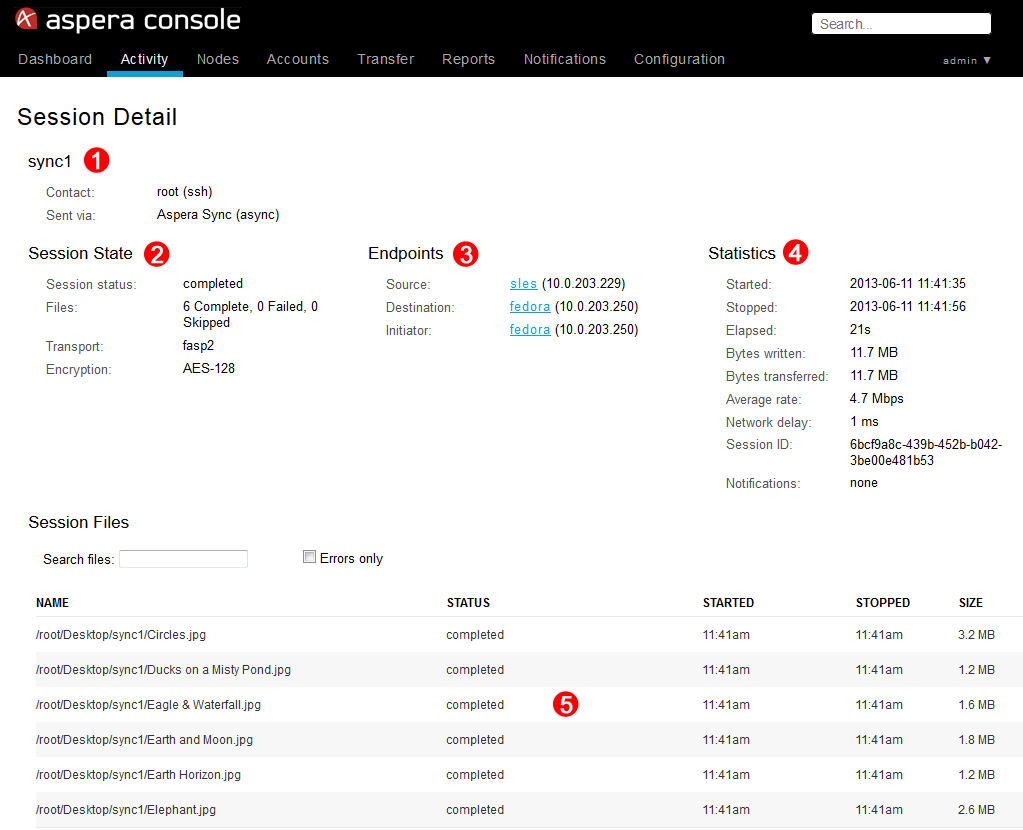
On the sync transfer's Session Detail page, you'll see the following information:
- (1) Session name.
- (2) Session State, which includes the session's status and synced files.
- (3) Sync source and destination.
- (4) Transfer statistics.
- (5) Details for synced files (which you can hover over and select within the Session Files table).
To view your sync jobs, go to . Note that this reporting information may not appear immediately. From the Sync Jobs table, you can view async job status. You can also remove data about a specific job by clickingremove log data under the ACTIONS column. To view a sync job's details, click the corresponding table row.
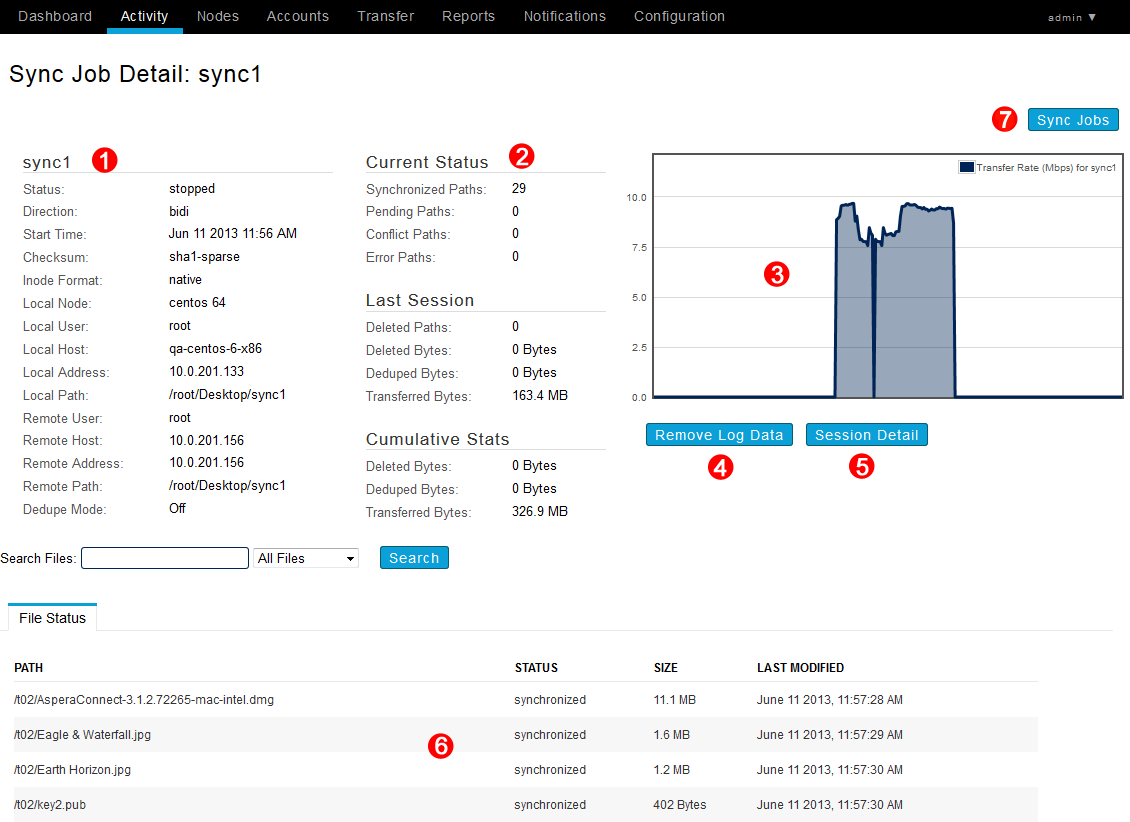
From the Sync Job Detail page, you can view the following information:
- (1) Local and remote server details, as well as session statistics (how many paths are synced/pending/conflicted/deleted/in error state).
- (2) Session statistics.
- (3) Transfer rate graph (Mbps vs time), which only appears during the transfer.
- (4) Remove log data button, which deletes this job's stats from the Console and async databases.
- (5) Session Detail button, which takes you to the Session Detail page described above.
- (6) Synced file information (status, size, and date/time modified).
- (7) Returns you to the Sync Jobs page.