Monitor Console and fasp network status through the Console dashboard.
The Dashboard provides a quick overview of all transfer activities and the node status which you have permissions to monitor. It gives continuous updates and helps identify transfer and node problems.
Go to Dashboard from the Console menu. The Dashboard contains the following six panels:
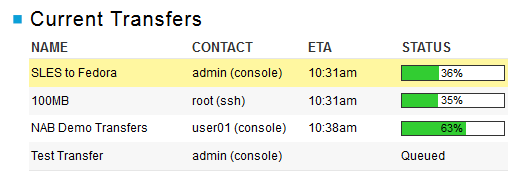
Current Transfers
Lists up to ten ongoing transfers on all managed nodes. To view all active transfers, click Current Transfers in the header. Console will open the Activity page with the proper filter set up.
Scheduled Transfers
Lists up to ten scheduled transfers on all managed nodes. To view all scheduled transfers, click Scheduled Transfers in the header, Console will open the Activity page with the proper filter set up.

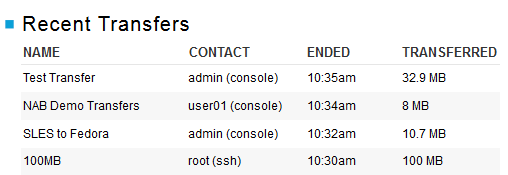
Recent Transfers
Lists up to ten recent transfers on all managed nodes. To view all recent transfers, click Recent Transfers in the header, Console will open the Activity page with the proper filter set up.
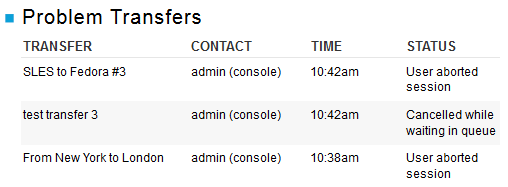
Problem Transfers
Lists up to ten transfers with error on all managed nodes. To view all transfers with error, click Problem Transfers in the header, Console will open the Activity page with the proper filter set up.
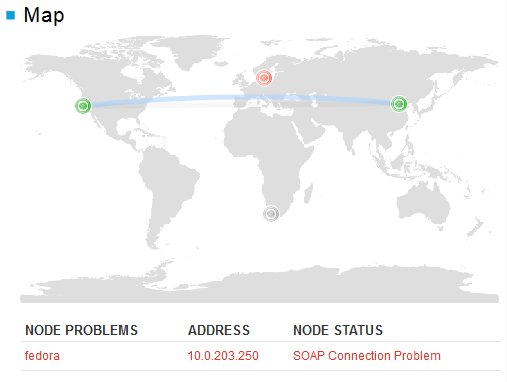
Map
The map indicates all the managed nodes' status, as well as the transfers between them. If a node fails, the icon becomes red in the map, and the node is listed with the problem in the table below.
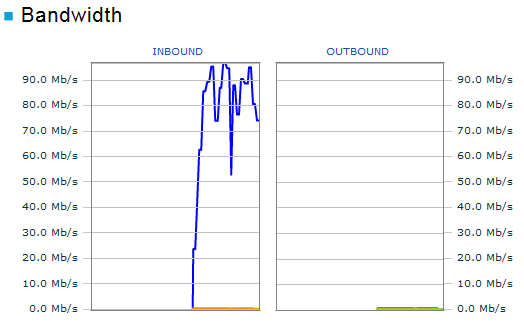
Bandwidth
By default, the Bandwidth panel shows bandwidth usage of all nodes. If you select one or more nodes on the map, it will show cumulative bandwidth of selected nodes.
